






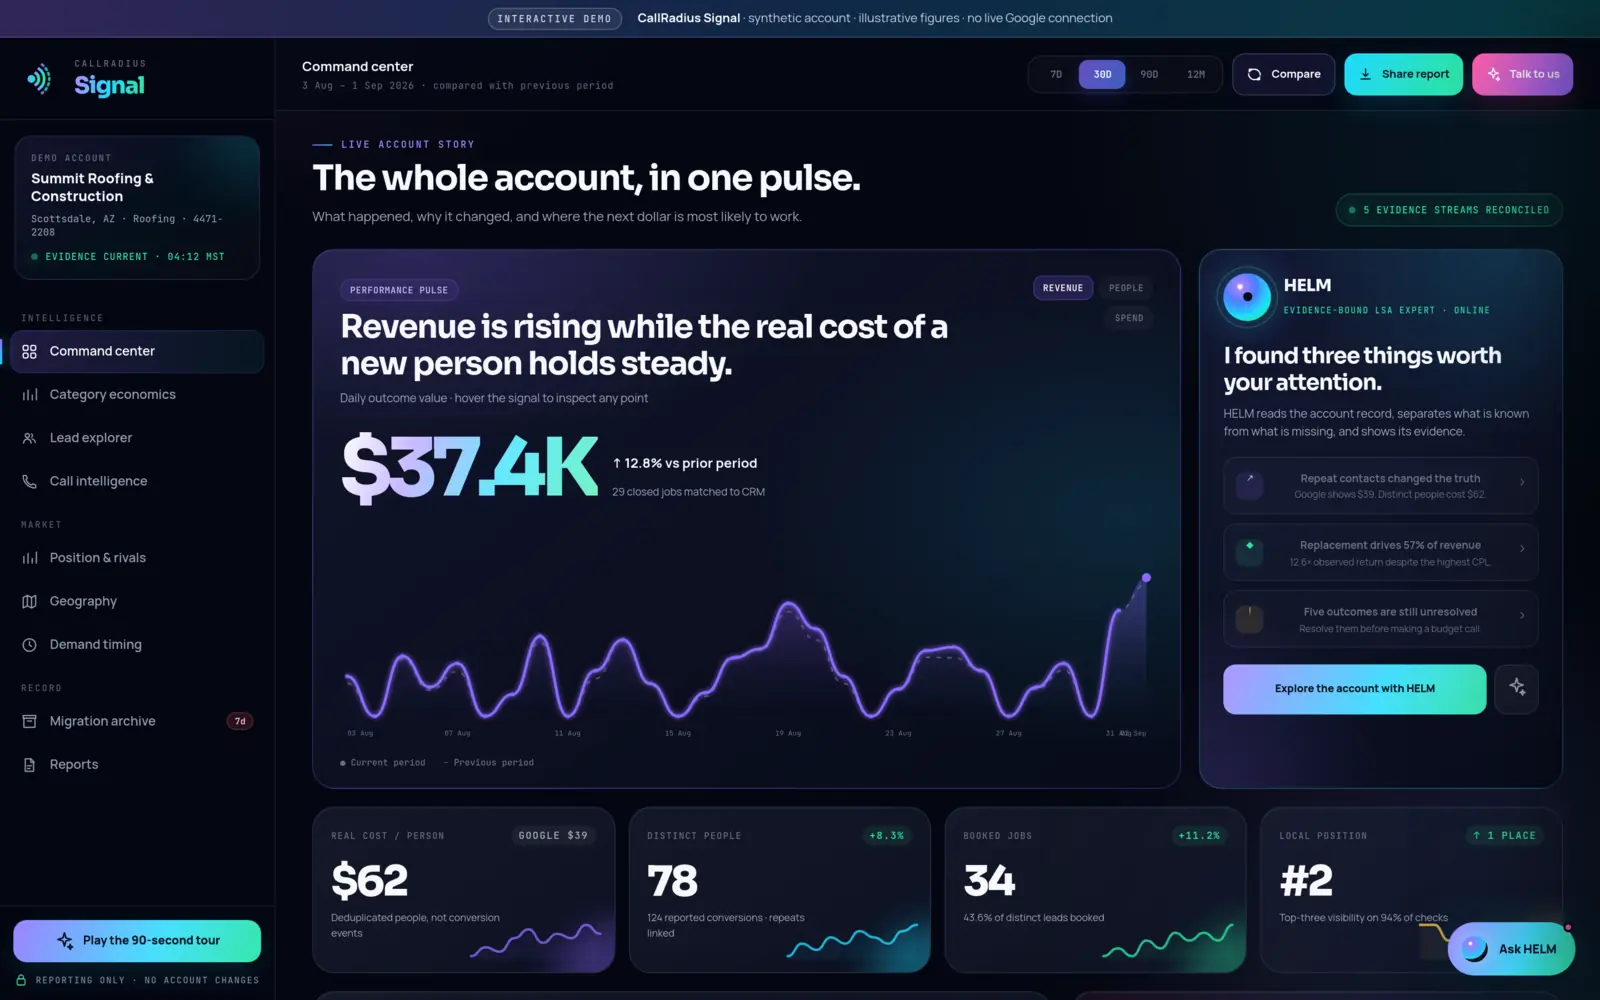

- A week has 168 hours. Leads cluster in some of them, and the pattern is usually stable enough to plan around.
- Arrival volume is only half the picture. The other half is how fast you respond in each block, and what that does to bookings.
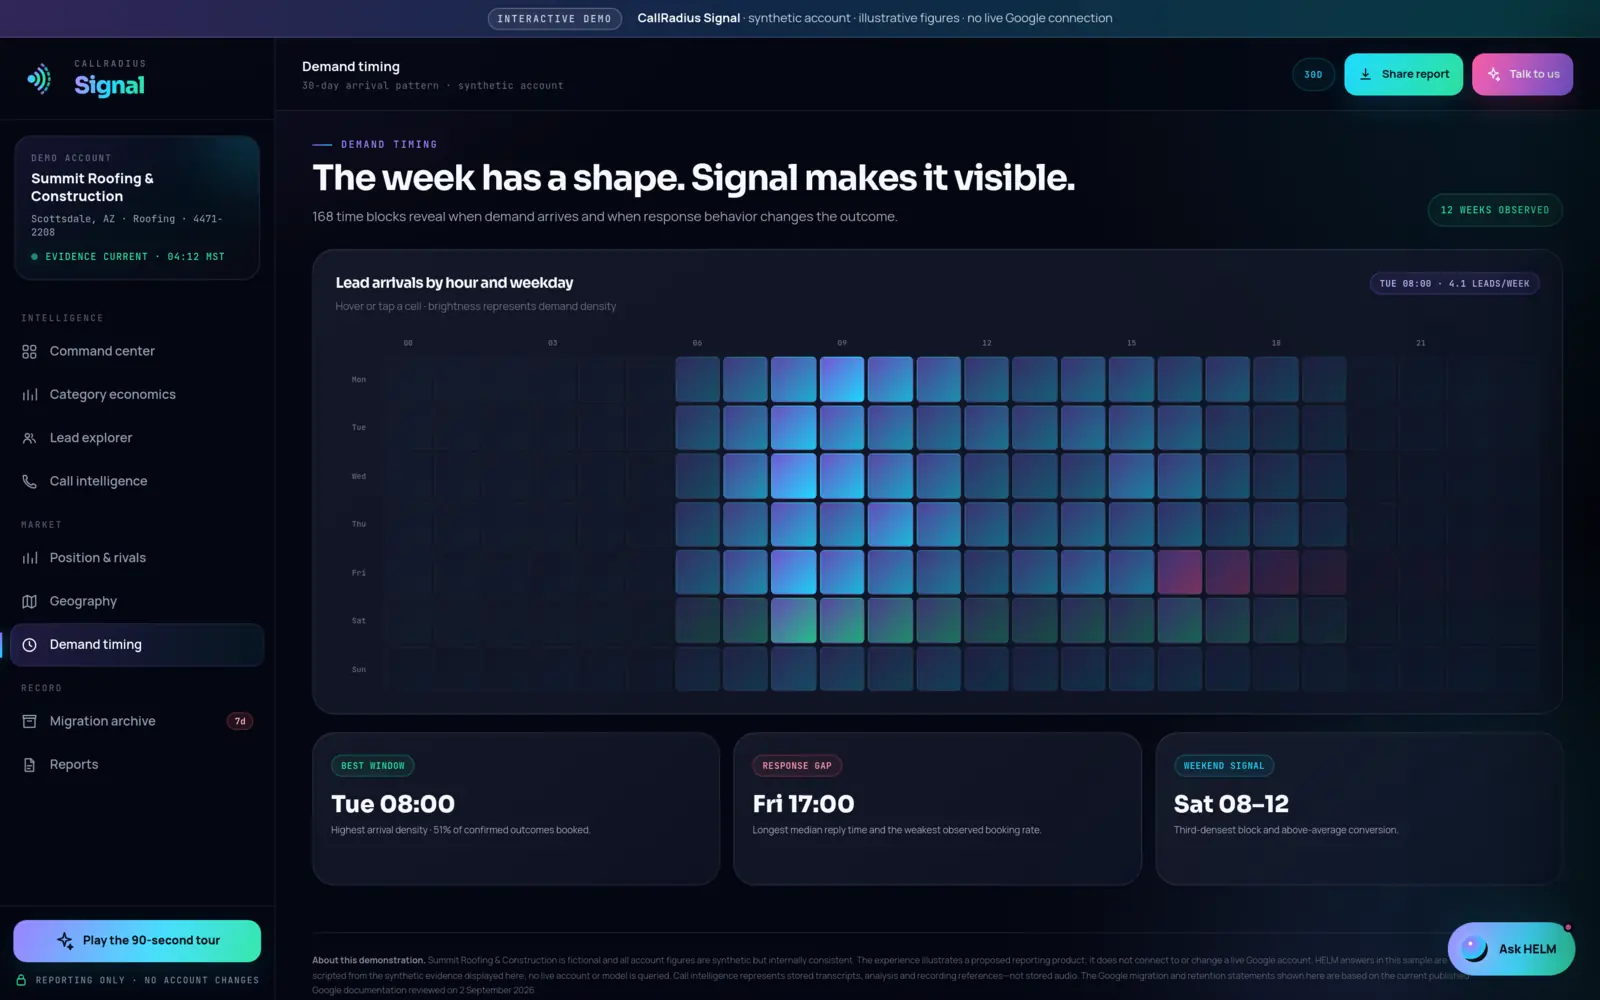
- In our public demo, a fictional roofer's busiest block is Tuesday at 8 a.m., and its weakest handling is Friday at 5 p.m.
- The first uses of the pattern are staffing and call handling, before any change to advertising.
- Wait for several weeks of data and look for patterns across neighboring hours, not single bright cells.
Why the week has a shape
People contact local businesses when the problem shows up and when they have a moment to deal with it. A leak is found first thing in the morning. A homeowner gets quotes on a lunch break. A storm on Saturday brings calls on Saturday. Those habits repeat, so lead arrivals form a shape across the week that's often surprisingly consistent.
Most owners have a feel for this ("Mondays are busy"), but a feel is coarse. The useful unit is the hour. Seven days times 24 hours is 168 blocks, and laying leads out on that grid shows things a daily total hides: the morning peak, the lunch dip, the quiet evenings, the one weekend window that behaves like a weekday.
What the demo's week shows
The demand timing screen in the CallRadius Signal live demo is a heatmap of those 168 blocks, built from 12 observed weeks. Brighter cells mean more leads. The business is Summit Roofing & Construction, which is fictional, and the figures are synthetic, but the reading method is the same for a real account. Three cards sit under the map:
| Card | Block | What the demo says |
|---|---|---|
| Best window | Tuesday, 8 a.m. | Highest arrival density, about 4.1 leads a week in that hour. 51% of confirmed outcomes booked. |
| Response gap | Friday, 5 p.m. | Longest median reply time and the weakest observed booking rate. |
| Weekend signal | Saturday, 8 a.m. to noon | Third-densest block and above-average conversion. |
Notice that two of the three cards aren't about volume at all. The Friday card is about response, and the Saturday card is about conversion. That's the real lesson of the screen: when leads arrive matters, but what happens to them in each hour matters more.
The demo's call intelligence screen, a Signal Pro feature, tells the same story from the phone side. HELM's scripted call brief says calls answered inside two minutes booked at nearly twice the rate of calls returned after ten minutes, and that Friday afternoons carry the clearest handling gap. In the demo, at least, slow answers on Friday afternoon cost bookings, not just convenience.
Three questions to ask your own heatmap
- Where are the peaks? Find the few blocks that carry the most leads. Those are the hours where a missed call is most expensive simply because there are more of them.
- Where is response slowest? Compare median reply time across the week. Slow blocks usually line up with shift changes, lunch, the end of the working day and weekends.
- Where do the two overlap? A busy block with slow response is the most expensive hour in your week. A quiet block with slow response matters less.
What to do with it: people before ads
The tempting response to a heatmap is to change advertising: spend more in the bright hours, less in the dark ones. Sometimes that's right. But the cheaper, faster wins are usually in staffing and call handling, because they improve what happens to leads you're already paying for.
Staffing
- Put your best phone person on the peak blocks. In the demo, that would be weekday mornings, led by Tuesday.
- Cover the end-of-day handoff. If the office closes at 5 and the field crew is still driving, the Friday 5 p.m. kind of gap appears. A clear rule for who answers between 4 and 6 is a simple place to start.
- Decide deliberately about the weekend. If a Saturday window converts well, as it does in the demo, a few hours of on-call coverage may pay for itself. If nobody can answer, that's worth knowing too.
Call handling
- Set a target reply time for missed calls and messages, and measure it by block, not as a single average. An average can look fine while one afternoon is a problem.
- Watch what happens to repeat contacts. People who don't get an answer call again, which inflates lead counts and makes cost per lead look better than it is. We explain why in Google says $39. The real number is $62.
Advertising
Only after staffing and handling are steady does it make sense to shift spend by hour. Our managed CallRadius service does this as part of its seasonal and schedule tuning, where spend follows each trade's seasonal demand and the hours leads actually arrive, with cooldowns that prevent over-correction. CallRadius Signal is read-only, so with Signal any change is yours to make.
How much evidence before acting
A heatmap is made of small numbers. Spread a month of leads across 168 blocks and most cells hold a handful or none. A single bright cell can be one busy afternoon. Some rules we'd follow:
- Use several weeks, not one. The demo uses 12 observed weeks. With fewer, treat the map as a sketch.
- Look for neighborhoods, not cells. A real peak usually spreads across two or three adjacent hours, or shows up on several weekdays at the same time. A lone bright square deserves suspicion.
- Check the counts behind the rates. "51% booked" means more when you know how many outcomes it's built on. Before trusting any rate, ask how many outcomes sit behind it.
- Mind the season. A summer pattern for an HVAC company may not hold in spring. Compare like with like.
- Change one thing, note the date, and watch. If you add Friday evening coverage, write it down and see whether the Friday response gap shrinks over the following weeks. Our guide Did that change work? covers how to judge it honestly.
The most expensive hour in your week is a busy one where nobody answers fast.
Try it on your own data
You can build a rough version yourself. Export a few months of leads with their timestamps, add columns for weekday and hour, and count leads in each of the 168 combinations with a pivot table. If you also have reply times and booked outcomes, add those as averages in the same grid.
CallRadius Signal builds this view automatically, alongside geography and position. The screens are explained in Position, rivals, geography and timing, and plans are on the Signal page. Enrollment is opening soon.
Questions about anything in this article? Talk to a person. We answer every message.