








- A blended average across locations can describe none of them. One strong market can hide a weak one.
- Define your markets first, then track cost per distinct person, booking rate and cost per booked job for each.
- Small markets produce small numbers. Label which reads are settled and which are still gathering evidence.
- Each location needs its own consistent facts, and its own AI buying questions that name the city.
The trouble with one blended number
Picture a plumbing company with two service areas. In one, the phones ring steadily and most callers book. In the other, leads cost more and fewer turn into jobs. Add them together and the account-wide cost per job looks acceptable. Nobody acts, because the average says things are fine.
That average describes a market that doesn't exist. The strong area may deserve more budget and the weak one may need a different approach, a closer look at call handling, or less spend. A blended figure hides both decisions.
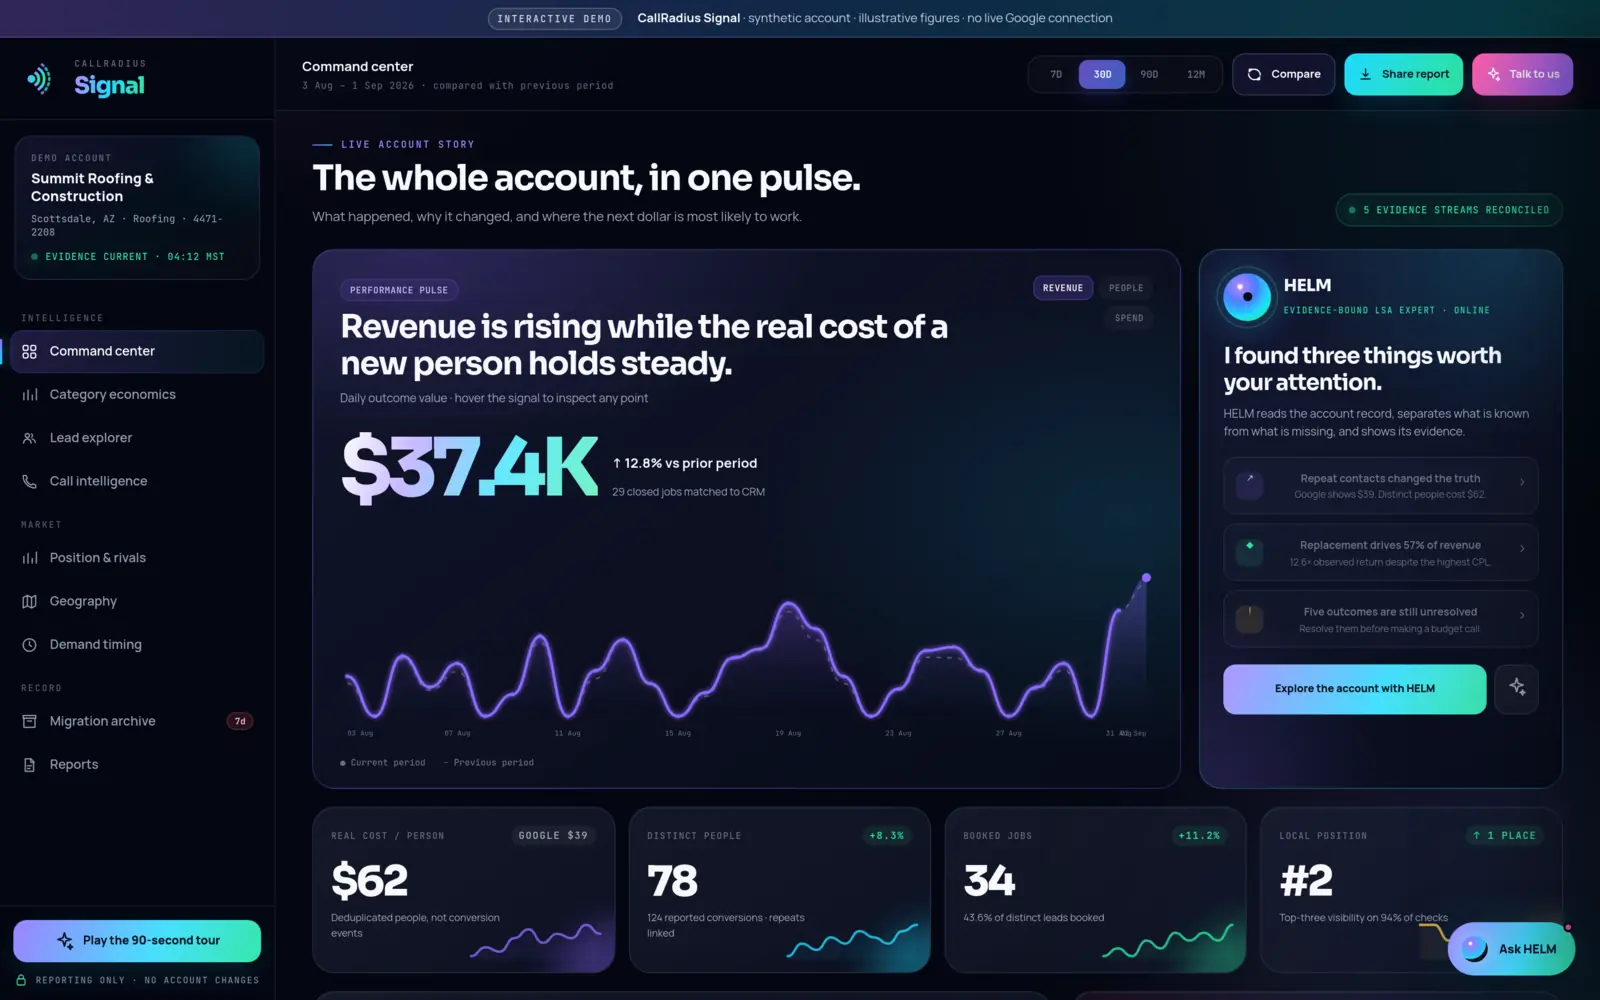
The CallRadius Signal public demo shows the effect with a fictional roofing company and synthetic figures. Across the whole account, 43.6% of distinct leads booked. Its strongest postcode, Scottsdale North (85254), showed a 58% booking rate on 19 leads. Same business, same month, a noticeably different picture once you look at one area on its own.
An average across markets can describe none of them.
Decide what a market is
Before you measure, agree on the units. For most businesses it's one of these:
- Physical locations. Each office, clinic or shop, with its own address, phone and staff.
- Service areas. Cities or groups of ZIP codes served from one base, often with very different travel times and job mixes.
- Both. Several locations, each serving its own spread of areas.
Pick groupings you'd actually make decisions about. Measuring forty ZIP codes separately is precise, but if you'd never change budget or staffing for one ZIP, group them into areas you would act on.
Per-market economics
For each market, track the same short list every month, with the same method:
| Measure | Why it matters per market |
|---|---|
| Distinct people | Volume without repeat contacts inflating it. How to count them. |
| Cost per distinct person | What a new customer really costs in that area. |
| Booking rate | Whether leads there turn into work. Low rates often point to fit, distance or call handling. |
| Cost per booked job | The figure that matters most for budget. |
| Matched revenue | What the work there was worth, with unmatched jobs noted. |
| Response time | Whether each location answers fast enough. |
Split by service category too, where you can. A market that looks weak overall may be strong for one kind of work. Our guides to position, rivals, geography and timing and category economics explain how CallRadius Signal presents these views.
Small numbers need patience
Splitting an account makes each piece smaller, and small numbers swing. A market with eight leads a month can double or halve its booking rate on two calls. That's noise, not a trend.
The demo's geography view handles this honestly. It reports 6 settled reads and 3 areas still gathering evidence, rather than ranking every area as if each had the same amount of data. Do the same in your own reporting:
- Label thin markets as gathering evidence until they have enough leads to judge.
- Use longer windows for small markets. A quarter may tell you more than a month.
- Avoid percentage headlines on tiny counts. Doubling from three bookings to six can happen by chance.
If you're managed, CallRadius compares lead and outcome evidence ZIP by ZIP and surfaces weak areas for manager review. Targeting changes stay human-authorized, which is the right default when the evidence is thin.
Consistent facts for every location
Several locations multiply the chances that a fact is wrong somewhere. A shared phone number on one listing, old hours on another, two locations merged into one in a directory: each sends customers, and the systems that read your listings, to the wrong place.
- Keep a source-of-truth row per location: name as customers see it, address or service area, phone, hours and the services offered there.
- Give each location its own page on your website with those facts, rather than one contact page listing everything.
- Check each location's profiles separately. A correct main listing doesn't mean the others are correct.
We cover the method in Your business facts are infrastructure now.
Ask AI about each city
Customers ask AI assistants local questions: "who's a good dentist in Chandler?" not "who's a good dentist in Arizona?" So test each market with questions that name its city or area.
- Write buying questions per market. Use the same question pattern for each city so you can compare.
- Ask the same providers each time, in fresh conversations, and record mentions, citations and competitors.
- Expect different competitors in each city. Your comparison set should change by market, and each market's share of voice should be read against its own set.
- Budget your questions. A fixed set of ten questions covering three cities leaves about three per city. Decide whether to go deep on your main markets or broad across all of them, and keep the choice steady.
Our 20-minute AI self-audit gives the method in detail.
Decide market by market
Once each market has its own numbers, decisions get clearer: more budget where cost per booked job is strong and capacity exists, a call-handling fix where booking rates lag, a new page where AI answers name competitors in one city and never you. Make one change at a time per market, date it, and compare that market against itself.
To see a postcode-by-postcode view, explore the geography screen in the CallRadius Signal live demo, where the business is fictional and every figure is synthetic. If you'd like to talk through a multi-location setup, contact us.
Questions about anything in this article? Talk to a person. We answer every message.