






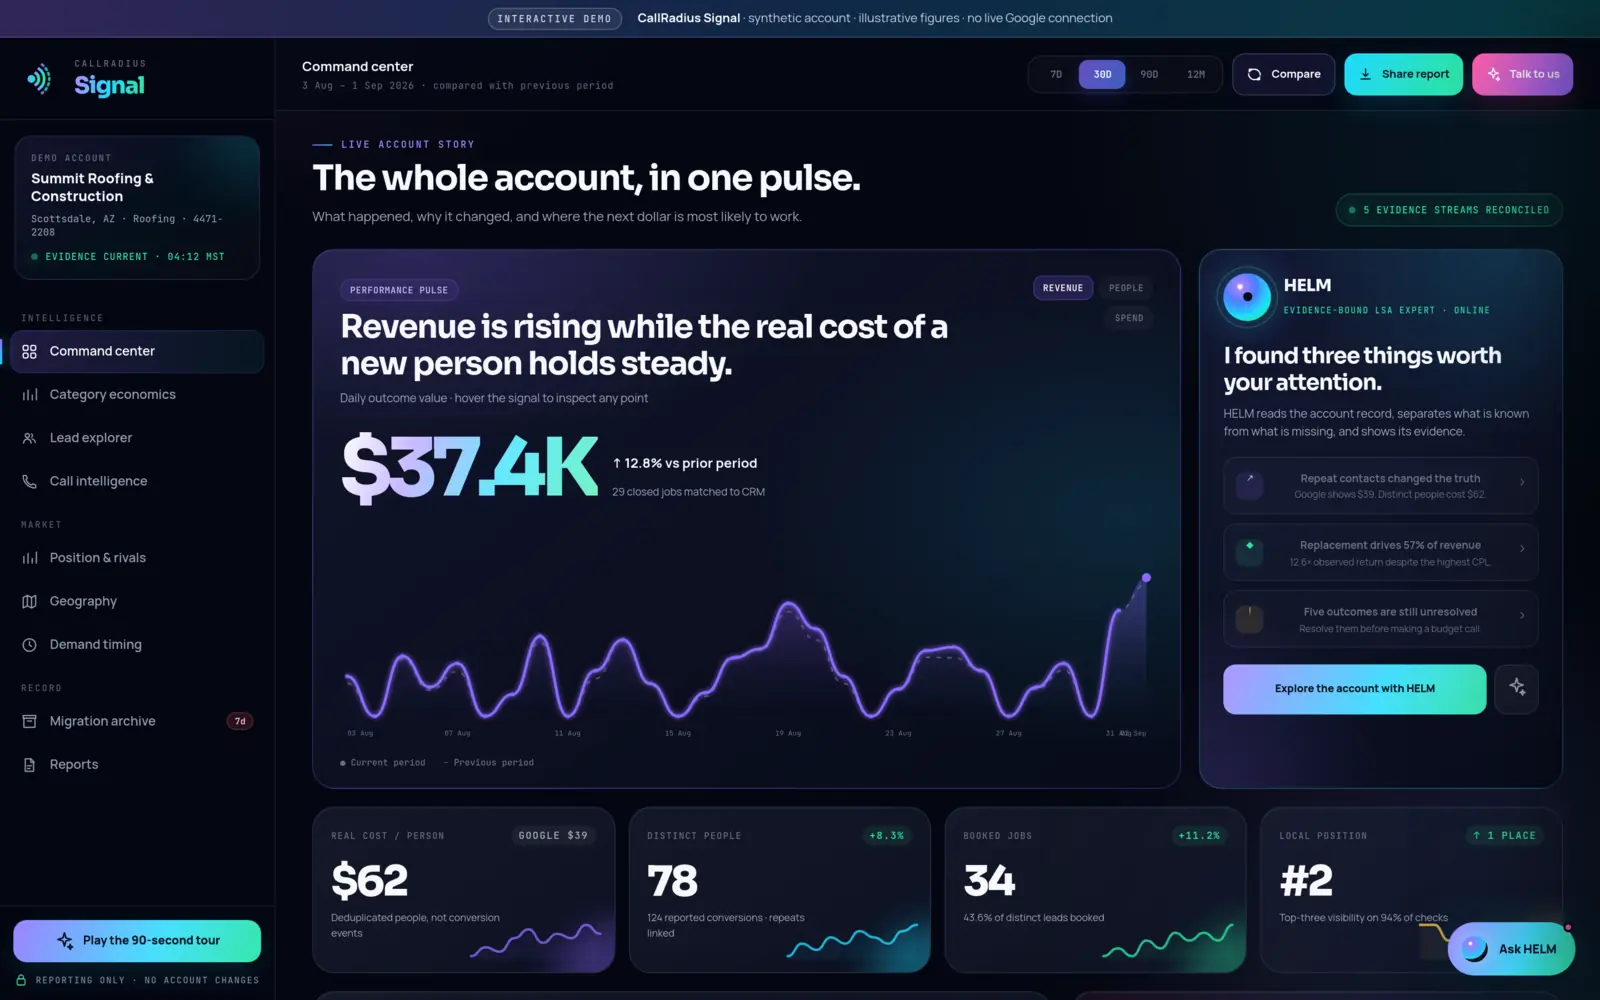

- A blended account average mixes cheap and expensive work, and profitable and unprofitable work, into one number that describes none of them.
- Category economics breaks your account down by service: leads, spend, real cost per lead, bookings, cost per booked job, revenue and return.
- The most expensive leads can be the most valuable. In the public demo, the service with the highest cost per lead creates the most observed value.
- Resolve unmatched outcomes and check the pattern over a longer period before you act on it.
Why a blended average hides what pays
Most owners judge their Local Services Ads with one number: cost per lead across the whole account. The trouble is that most businesses sell more than one kind of work. A roofer might do repairs, inspections and full replacements. A plumber might do drain clearing and water heater installs. Those jobs bring different lead costs, different booking rates and very different revenue.
Average them together and you get a figure that describes no actual job. Worse, it can point you the wrong way. If you chase the lowest cost per lead, you may end up buying more of your least valuable work.
The category economics screen in CallRadius Signal exists to break that average apart. It shows lead cost, booking rate, observed revenue and return, category by category.
What the screen shows
The screen has three parts:
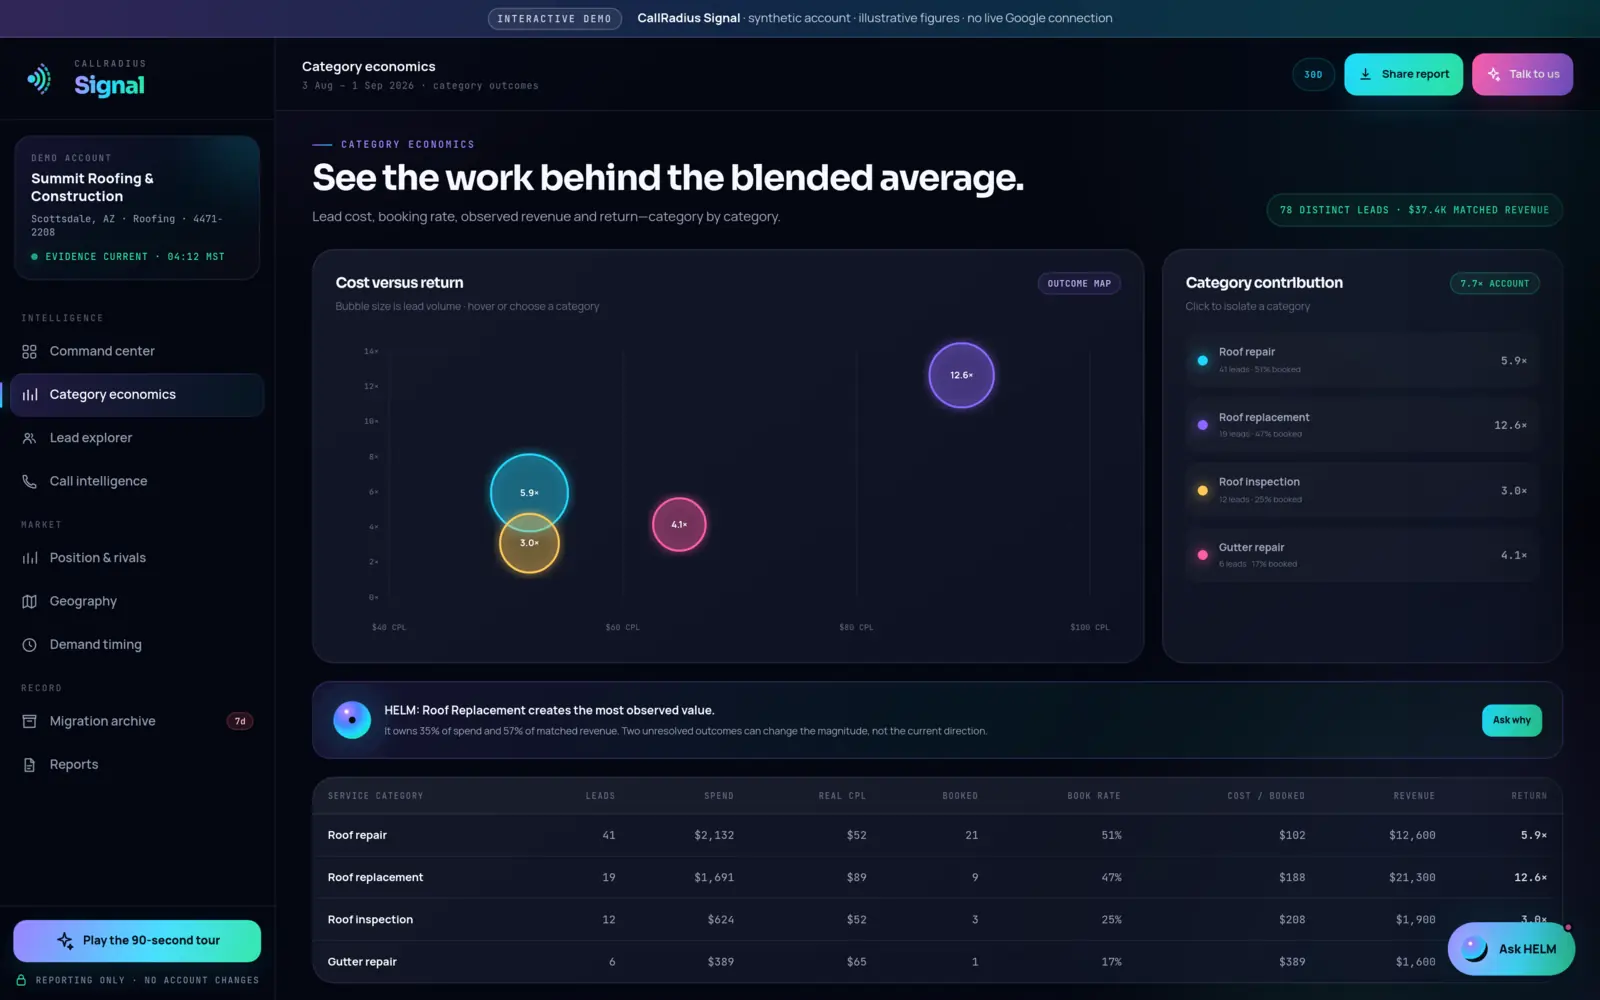
- Cost versus return. A bubble chart that places each category by what it costs and what it returns. Bubble size is lead volume, so you can tell a big category from a small one at a glance.
- Category contribution. A view of how much each category contributes to the account. You can click a category to isolate it. In the demo, the whole account shows a 7.7x observed return.
- The category table. One row per service category, with the columns explained below.
In the public demo, which uses a fictional roofing company with synthetic figures, the screen summarizes 78 distinct leads and $37.4K of matched revenue.
The columns, one by one
| Column | What it tells you |
|---|---|
| Leads | How many leads the category produced. Signal works with distinct people, linking repeat contacts, so this is not a raw count of conversion events. |
| Spend | What the category cost in the period. Where a figure is an estimate or an allocation rather than a direct measurement, Signal says so on screen. |
| Real CPL | Spend divided by distinct people in that category. See why real cost per person differs from Google's figure. |
| Booked | How many of those leads became booked jobs. |
| Book rate | Booked jobs as a share of leads. A low rate can mean poor-fit leads, or leads that weren't handled well. |
| Cost / booked | Spend divided by booked jobs. This is closer to what a piece of work actually costs you than cost per lead is. |
| Revenue | Revenue matched to booked jobs in the category. Signal combines Google's data with figures you enter yourself, such as what a job was worth. |
| Return | Matched revenue compared with spend, shown as a multiple. It is an observed figure, so it only counts revenue that has been matched. |
Read the table from left to right as a chain. Cheap leads that rarely book are not cheap. Expensive leads that book often and bring big jobs may be the best money you spend.
The demo example: Roof Replacement
Here is the clearest case in the demo account. Remember, the business is fictional and every figure is synthetic.
HELM's summary on the screen reads: Roof Replacement creates the most observed value. It owns 35% of spend and 57% of matched revenue. On the command center, HELM adds that it delivers a 12.6x observed return despite the highest cost per lead.
The category with the most expensive leads is the one producing the most value.
If the owner judged the account only on cost per lead, Roof Replacement would look like the problem. Its leads cost the most. Measured by what it brings in, it's the strongest: 57% of matched revenue from 35% of spend.
The same numbers also show what the blended figure hides on the other side. The account as a whole returns 7.7x. If one category returns 12.6x on 35% of spend, the remaining categories together must return less than the account average. By our arithmetic from the demo's rounded percentages, the other 65% of spend returns roughly 5x. That isn't necessarily bad, but it's a very different picture from a single 7.7x.
Magnitude versus direction
HELM also notes that two unresolved outcomes can change the magnitude, not the current direction. In plain terms: once those outcomes are matched, the exact percentages and the 12.6x figure may move. But the conclusion that Roof Replacement is the strongest observed value driver would not reverse on those two outcomes alone.
This is the distinction worth carrying into your own account. Some gaps in the data can flip a conclusion. Others can only change how strong it is. HELM separates what's known from what's missing so you can tell which is which. See how HELM works.
How to act on it carefully
- Resolve outcomes first. Match booked jobs to revenue before judging return. In the demo, five booked outcomes across the account are still unmatched, and HELM advises resolving them before making a budget call.
- Check the volume. A category with a handful of leads can show an extreme return from one big job. Bubble size helps here: be cautious with small bubbles.
- Look over a longer period. Compare 90 days or 12 months with the last 30 and see whether the pattern holds. Seasonal work can make one month misleading.
- Use cost per booked job, not cost per lead. It accounts for how often each kind of lead turns into work.
- Change one thing and note the date. If you shift emphasis toward a category, make one change at a time in your own Google account and record when. Then compare like with like. Did that change work? covers how.
- Ask why. The screen includes an "Ask why" prompt so HELM can explain the evidence behind a category's numbers.
To see where this screen fits in the product, read How CallRadius Signal works or the command center guide.
Common questions
Why does a category with the highest cost per lead show the best return?
Because cost per lead ignores what the work is worth. A high-value job can justify an expensive lead many times over. In the demo, Roof Replacement has the highest cost per lead and a 12.6x observed return.
What does "observed" return mean?
It counts only revenue that has been matched to booked jobs. Unmatched outcomes aren't guessed at, so the figure can change as they are resolved.
Where does the revenue figure come from?
Signal reports the data Google provides together with figures you enter yourself, such as what a job was worth. Where a figure is an estimate or allocation, Signal says so on screen.
Should I move all my budget to the best category?
Not on one screen's evidence. Resolve outcomes, check volume and a longer period, and change one thing at a time. Signal guarantees no particular outcome, and neither does any budget move.
Questions about anything in this guide? Talk to a person. We answer every message.